
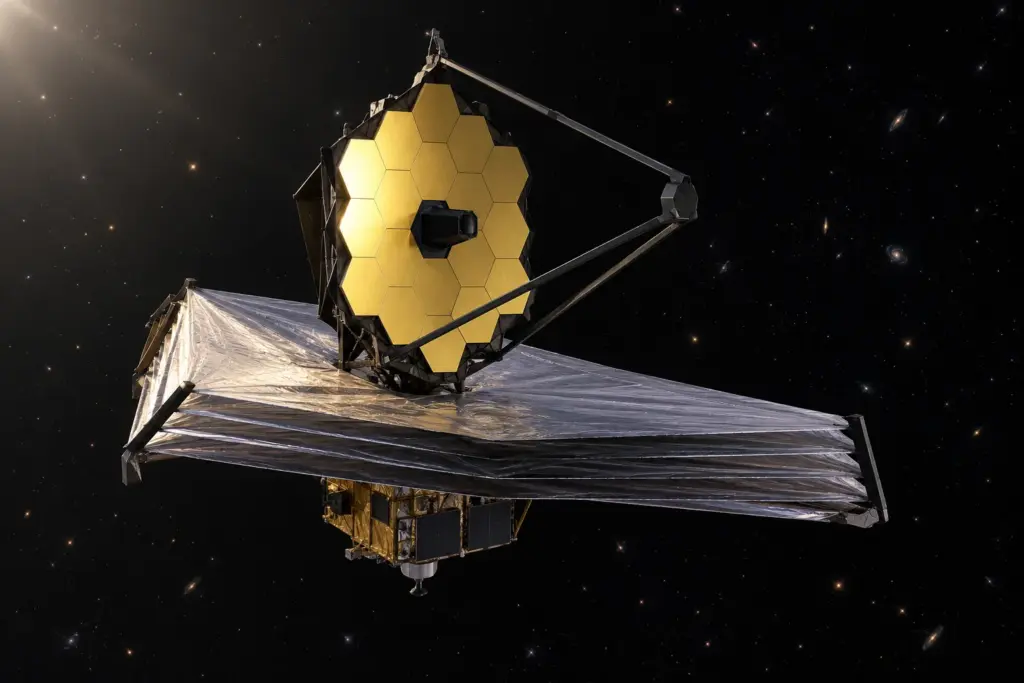
Research checked: 20 October 2026. Specifications below describe nominal capabilities, with individual observing modes identified where necessary. Operational availability and calibration guidance can change between proposal cycles.
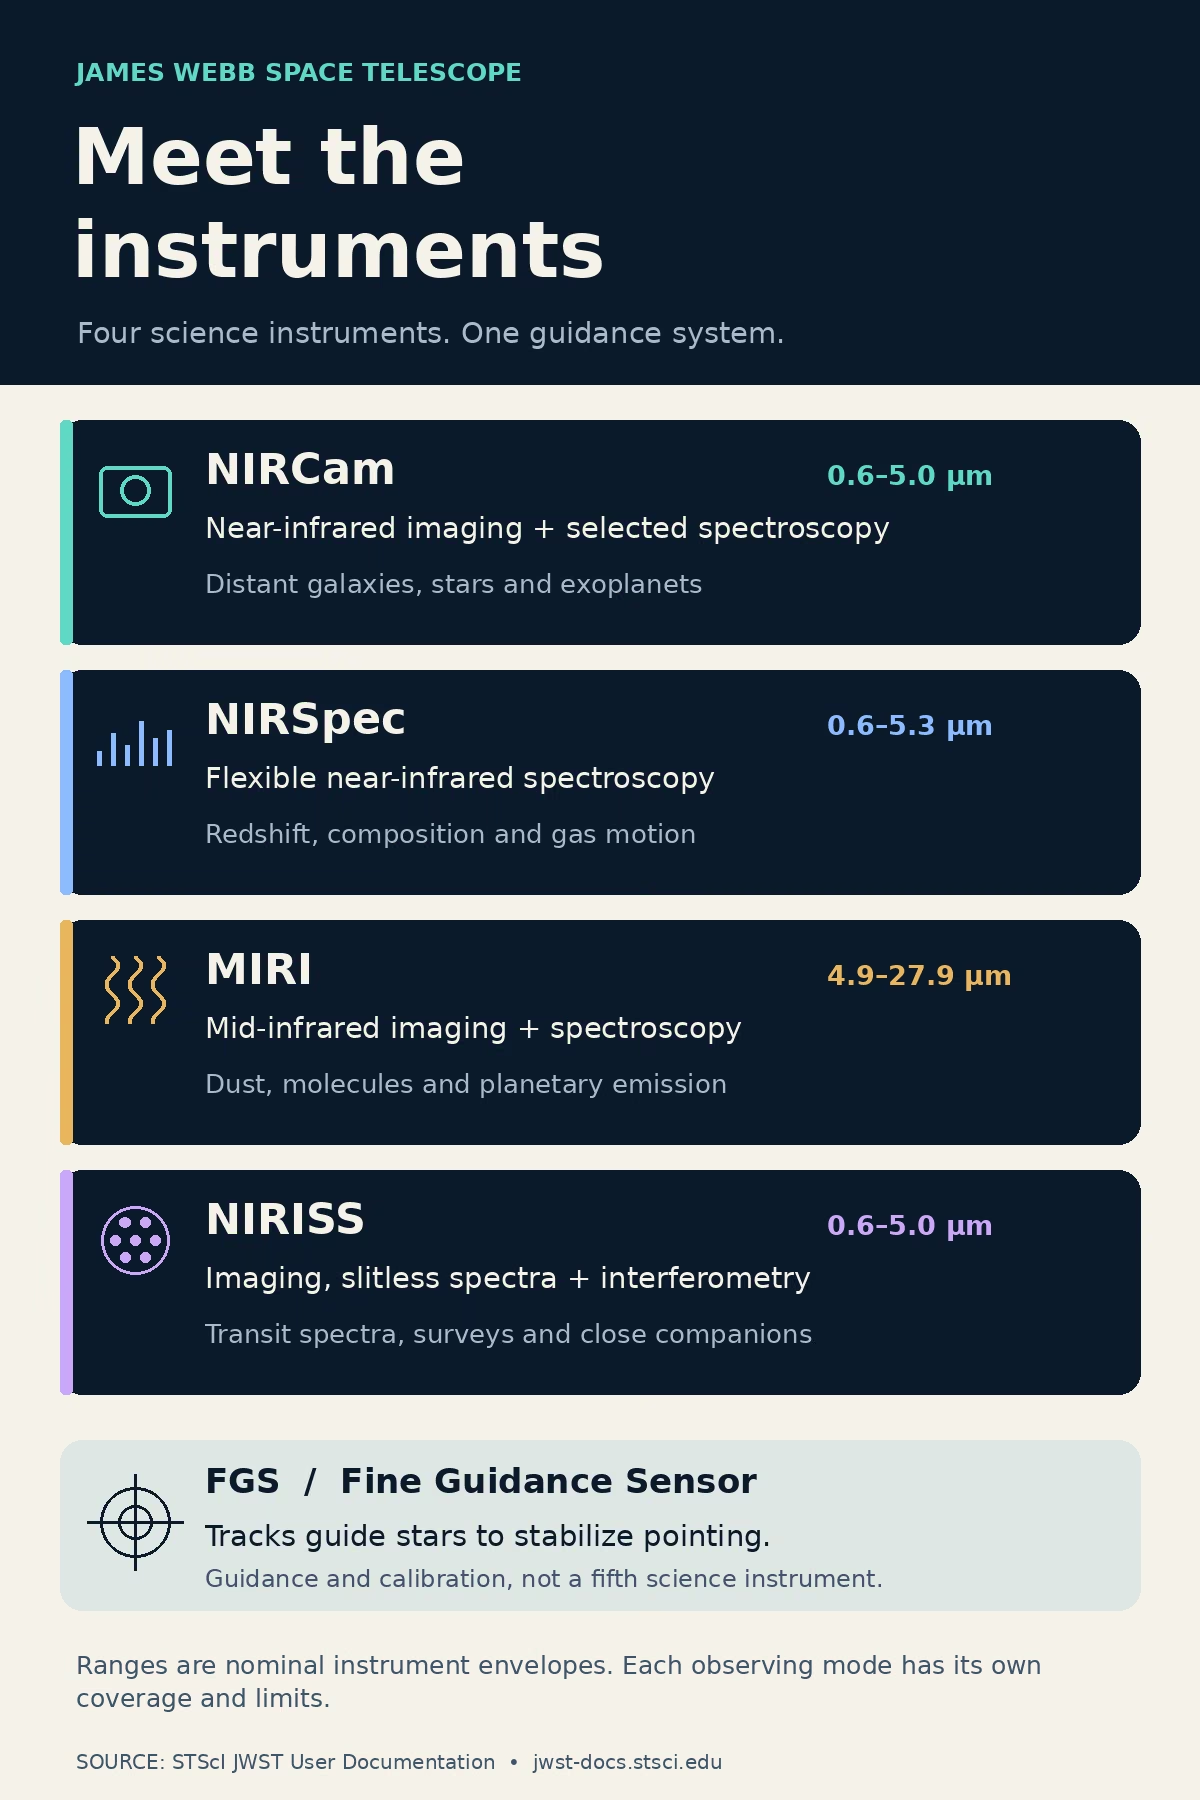
The James Webb Space Telescope uses four science instruments to turn infrared light into measurements of galaxies, stars, planets, gas, and dust. NIRCam captures near-infrared images and selected spectra. NIRSpec specializes in near-infrared spectroscopy.
MIRI extends observations into the mid-infrared, while NIRISS supplies specialized imaging, slitless spectroscopy, and interferometry. A separate Fine Guidance Sensor keeps observations accurately pointed. Together, these systems connect the appearance of astronomical objects with evidence about their composition, physical conditions, and evolution.[1][2][3][4][5]
Understanding Webb’s Scientific Instruments
JWST is a NASA, ESA, and Canadian Space Agency mission, with science operations and the archive supported by the Space Telescope Science Institute, or STScI. Its instruments sit behind the telescope optics within the Integrated Science Instrument Module, known as ISIM.
Their different detectors, filters, dispersers, and apertures let astronomers ask complementary questions. Images establish where objects are and how their brightness varies across filters. Spectra separate light by wavelength, allowing more specific tests of redshift, chemistry, temperature, and motion.[1][6]
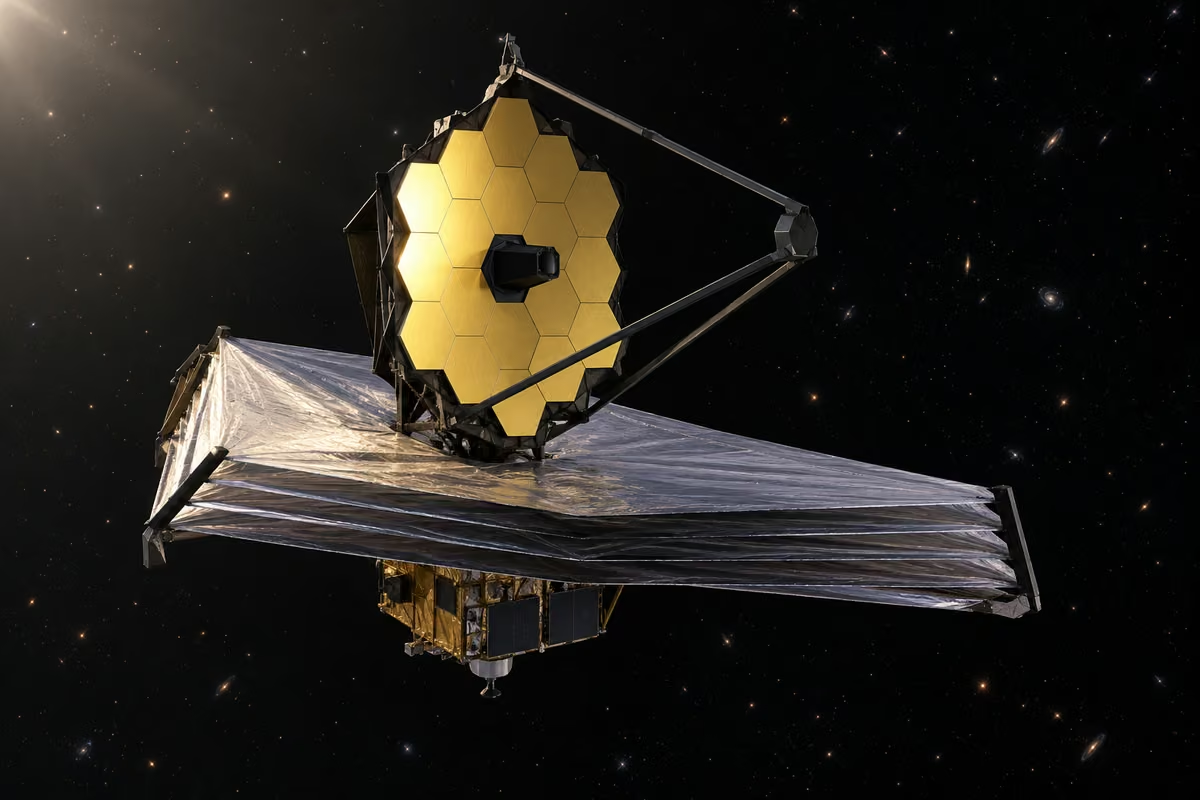
What Are the Scientific Instruments on the James Webb Space Telescope?
Webb’s instrument suite is organized around measurements rather than a single camera design. A distant galaxy might first appear in NIRCam imaging, then receive a NIRSpec spectrum, with MIRI adding longer-wavelength information if the source is sufficiently bright.
NIRISS offers additional spectroscopy and interferometry suited to different targets. These observations require accurate pointing, so FGS supports the science instruments throughout normal guided observations. Understanding the suite therefore means distinguishing the measurement equipment from the systems that keep those measurements stable.[2][3][4][5][7]
How Many Scientific Instruments Does JWST Have?
JWST has four science instruments: NIRCam, NIRSpec, MIRI, and NIRISS. FGS is frequently listed beside them because it belongs to the same observatory payload and is closely associated with NIRISS, but it serves guidance and calibration. General observers cannot propose FGS as a fifth science instrument.
The distinction matters when comparing capabilities: a guider produces detector images for locating and tracking stars, yet that does not make it interchangeable with a science imager offering selectable filters and observing templates.[1][7]
How Do JWST Instruments Work Together?
The instruments contribute different pieces of evidence. Imaging can identify a faint source, map its structure, and estimate its colors. Spectroscopy can test whether those colors indicate a distant galaxy, identify emission lines, or measure atmospheric absorption.
Longer-wavelength observations can separate dust emission from stellar light. However, the instruments occupy different positions in Webb’s focal plane. Studying exactly the same target with another instrument usually requires repointing and a separate observation, rather than sending the same target’s light to every instrument simultaneously.[8][9]
What Is the Integrated Science Instrument Module?
The Integrated Science Instrument Module provides the framework and supporting systems that connect Webb’s instruments to the observatory. Its cold instrument structure sits behind the primary mirror, where the telescope directs focused light toward the instrument entrances.
ISIM also encompasses supporting electrical and thermal interfaces distributed across different temperature regions. Mechanical alignment keeps each aperture properly located, while thermal management limits changes that could disturb focus or calibration. Electronics command exposures, read detector signals, and pass the resulting information into the spacecraft’s data system.[6][10]
Which JWST Instrument Is Used for Each Scientific Task?
Instrument selection begins with the property an astronomer needs to measure. Detailed near-infrared structure generally points toward NIRCam; spectra of selected galaxies favor NIRSpec. Mid-infrared dust emission and molecular features require MIRI. Bright-star transit spectra at shorter wavelengths often suit NIRISS SOSS, while its survey mode provides spectra across a field.
FGS supports the pointing needed by these observations. These are starting points rather than universal rankings, because brightness, wavelength, target size, contamination, and required precision determine the final choice.[2][3][4][5]
| Instrument | Main function | Representative applications |
|---|---|---|
| NIRCam | Near-infrared imaging, coronagraphy, selected spectroscopy | Early galaxies, stellar nurseries, planets and disks |
| NIRSpec | Near-infrared spectroscopy | Redshifts, composition, gas dynamics, transit spectra |
| MIRI | Mid-infrared imaging and spectroscopy | Dust, molecular gas, disks, planetary thermal emission |
| NIRISS | Imaging, slitless spectroscopy, aperture masking interferometry | Transit spectra, galaxy surveys, close companions |
| FGS | Guidance and calibration | Guide-star tracking and stable telescope pointing |
Near-Infrared Camera: NIRCam
The Near-Infrared Camera is Webb’s principal instrument for conventional near-infrared imaging, with nominal coverage from 0.6 to 5.0 micrometers. A micrometer, written µm, is one millionth of a meter. NIRCam combines two imaging modules, simultaneous short- and long-wavelength channels, coronagraphic optics, and spectroscopic elements. Its capabilities connect wide astronomical surveys with detailed observations of individual objects. It also has an engineering role: images from NIRCam help measure the optical alignment of Webb’s segmented telescope.[2][11][12]
What Is NIRCam and What Does It Do?
NIRCam measures how infrared brightness changes across the sky and across selected wavelength bands. Its filter images reveal galaxy shapes, stellar populations, young stars, and structures around bright sources. Comparing measurements from several filters helps astronomers identify unusual colors and estimate candidate redshifts before obtaining spectra.
NIRCam also supports time-series observations, allowing changes in brightness or spectra to be followed. Its overall wavelength envelope does not mean every exposure records all wavelengths: the selected filters or dispersers define the information collected.[11][13]
How Does NIRCam Capture Infrared Images?
A dichroic optical element separates incoming light into short- and long-wavelength paths, allowing paired observations of nearly the same sky area. The short channel covers approximately 0.6–2.3 µm, and the long channel approximately 2.4–5.0 µm. Across both modules, eight HgCdTe detector arrays serve the short channels and two serve the long channels. Filters limit each image to a selected passband. The detectors accumulate charge from arriving photons, and repeated electronic readings provide the measurements later calibrated into astronomical images.[11][14]
What Are NIRCam Coronagraphs?
NIRCam’s coronagraphs suppress the bright central light of a star so nearby faint structures become easier to measure. Occulting masks work with pupil-plane optics that reduce diffracted starlight. Remaining stellar patterns must still be modeled or subtracted, often using reference observations.
This mode is useful for selected young giant planets, brown dwarfs, and circumstellar debris disks. Detectability depends on the companion’s brightness, separation, observing wavelength, and calibration quality. A coronagraph reduces glare but cannot reveal every planet near every star.[15][16]
How Does NIRCam Use Grisms for Spectroscopy?
A grism combines a prism with a diffraction grating to spread light into a spectrum while fitting a compact optical path. NIRCam’s long-wavelength grisms provide slitless spectroscopy across selected portions of 2.4–5.0 µm, with resolving power around 1,600 near 4 µm.
They support both surveys and repeated spectra of individual bright sources. Current capabilities also include short-wavelength time-series spectroscopy using the Dispersed Hartmann Sensor, or DHS, with first-order resolving power around 300. Wavelength throughput and usable coverage depend on configuration.[17][18][19]
How Does NIRCam Support Wavefront Sensing and Control?
Webb’s primary mirror consists of separate segments that must act as one accurately aligned optical surface. Small segment-position errors change the incoming wavefront and distort the pattern of a star’s image. NIRCam records specially configured stellar images that allow engineers to infer these errors.
Commands to mirror actuators then correct the alignment when needed. This process, called wavefront sensing and control, maintains image quality across the observatory. It is different from fine guiding, which corrects pointing rather than the relative alignment of mirror surfaces.[12]
What Scientific Discoveries Can NIRCam Enable?
NIRCam can locate candidate early galaxies, reveal embedded stars, map nearby galaxies, and measure structures in disks around stars. Its filter combinations help distinguish stellar light, ionized-gas emission, and selected dust features. Time-series imaging and spectroscopy add information about variable sources and planets crossing their host stars.
A useful example is the Tarantula Nebula, where NIRCam revealed large populations of young stars previously obscured in visible-light views. Interpreting those images still requires calibration, distance information, and comparison with other measurements.[20][21]
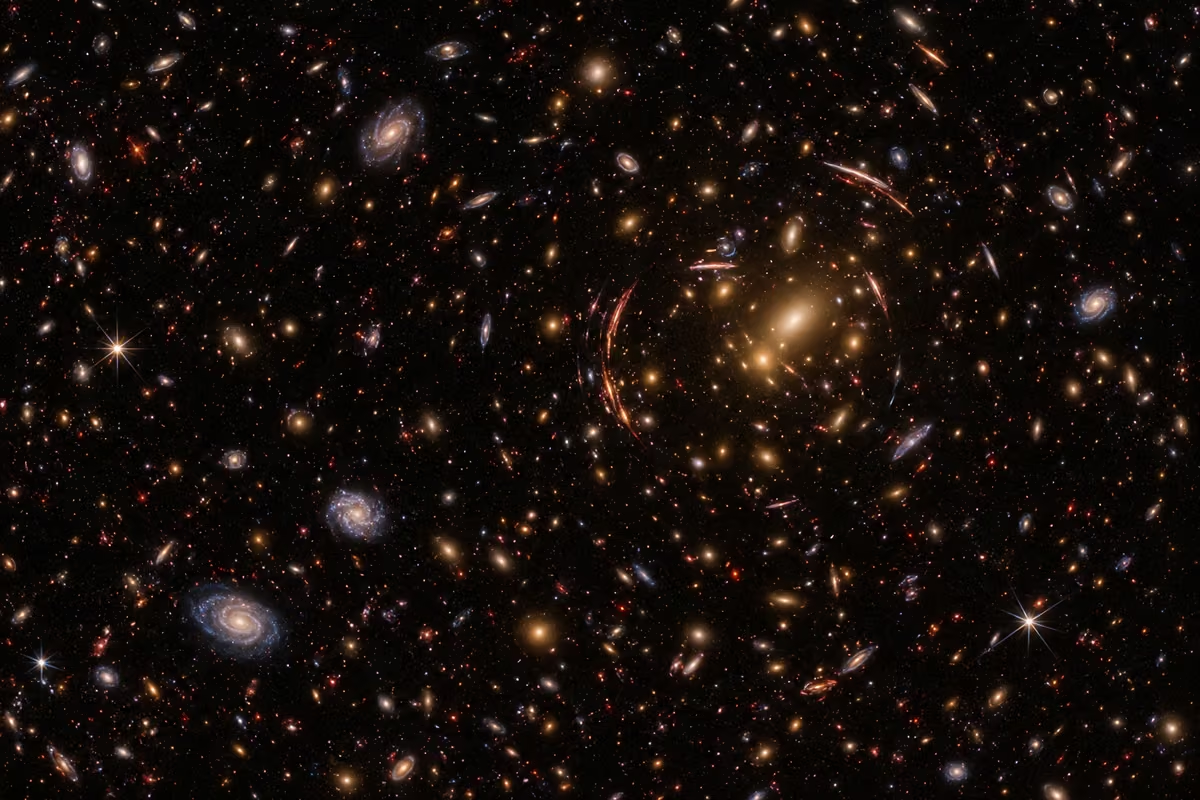
Near-Infrared Spectrograph: NIRSpec
NIRSpec separates near-infrared light into spectra over an overall range of approximately 0.6–5.3 µm. Its defining strength is flexibility in how light enters the spectrograph: programmable microshutters select many sources, fixed slits isolate individual targets, and an integral field unit maps a compact region.
A dedicated bright-object time-series mode supports repeated stellar spectra. These options address different scientific questions using the same general dispersive system. Wavelength coverage and resolution depend on the selected aperture, filter, disperser, and detector configuration.[3][22]
What Is NIRSpec?
The Near-Infrared Spectrograph is designed to measure the wavelength structure of astronomical light rather than produce general-purpose survey images. Spectral features can establish a galaxy’s redshift, constrain chemical abundances, or reveal gas affected by stars and active galactic nuclei. NIRSpec also studies individual stars and exoplanet host systems.
It includes imaging for target acquisition, but this serves accurate placement in the science apertures. The presence of an acquisition image should therefore not be interpreted as a replacement for NIRCam’s science imaging capabilities.[3]
How Does NIRSpec Perform Spectroscopy?
Light first passes through a selected entrance aperture, then through optics that disperse wavelengths onto the detectors. NIRSpec uses a prism for low-resolution spectroscopy and diffraction gratings for medium- and higher-resolution observations. The resulting detector pattern contains the source continuum and any absorption or emission features.
Calibration assigns wavelengths and converts signal levels into physical measurements. Interpreting those features requires accounting for instrumental broadening, background, and source structure. A line’s presence can be informative, but quantitative abundances usually require several diagnostics and physical models.[22]
What Is the NIRSpec Microshutter Array?
The microshutter assembly, often called the MSA or microshutter array, contains roughly 250,000 shutters distributed across four quadrants. Each quadrant has 365 by 171 shutters. Observers program patterns that admit light from selected objects and block much of the surrounding field.
An individual open shutter subtends approximately 0.20 by 0.46 arcseconds. Target placement, shutter operability, leakage, and overlapping spectra limit useful configurations. The shutter count describes hardware capacity, not the number of clean, independent galaxy spectra that every exposure can produce.[23][24]
What Is Multi-Object Spectroscopy?
Multi-object spectroscopy, or MOS, records spectra from many selected sources during the same exposure. In NIRSpec, the observer builds microshutter configurations around a catalog of target positions. This makes the mode efficient for galaxy surveys where many objects fit within the approximately 3.4 by 3.6 arcminute MSA field. Efficiency depends on the target distribution and whether their dispersed traces conflict. Accurate astrometry is essential: placing a faint galaxy near a shutter edge can reduce throughput and complicate interpretation of its measured spectrum.[24][25]
How Does NIRSpec Fixed-Slit Spectroscopy Work?
Fixed-slit spectroscopy directs a selected source through one of NIRSpec’s permanently defined entrance apertures. Target acquisition establishes its position before the science sequence, helping control slit losses and wavelength-dependent throughput. This approach suits isolated stars, compact objects, and other cases where a single target deserves concentrated attention.
Aperture choice affects background, target-placement tolerance, and transmitted light. Extended objects require additional care because the slit samples only part of their structure, so the resulting spectrum may not represent the whole source.[26][27]
What Is the NIRSpec Integral Field Unit?
The NIRSpec integral field unit, or IFU, obtains spatially resolved spectra across a region approximately 3 by 3 arcseconds. An image slicer rearranges the field into narrow sections that can be dispersed through the spectrograph. Processing reconstructs a cube with two sky coordinates and one wavelength coordinate. Astronomers can extract spectra from chosen regions or make maps of selected emission lines. This allows studies of galaxy nuclei, nebulae, and compact extended targets without reducing the entire object to one summed spectrum.[28][29]
What Are NIRSpec’s Spectral Resolution Modes?
NIRSpec offers a low-resolution prism and two families of gratings commonly summarized by nominal resolving powers near 100, 1,000, and 2,700. These values describe broad categories rather than constants valid at every wavelength. The prism’s resolving power changes particularly strongly across its range.
Grating observations also divide coverage into filter-dependent bands, so higher resolution generally requires more configurations to cover the full instrument envelope. The useful choice depends on whether the science requires broad continuum information, separated spectral features, or detailed line profiles.[22]
Low-Resolution Spectroscopy
The prism configuration provides broad near-infrared coverage in a single setup, making it valuable for faint targets and exploratory spectra. Its resolving power varies approximately from 30 to 300 across wavelength, despite often being abbreviated as R near 100. This variation affects how easily neighboring features can be separated.
For very faint galaxies, broad coverage can be more useful than detailed line profiles because it captures continuum breaks and several possible emission features together. Exact detector coverage still depends on source position and observing configuration.[22][30]
Medium-Resolution Spectroscopy
The medium-resolution gratings provide nominal resolving power around 1,000, separating spectral features more clearly than the prism. They support measurements of individual emission lines and improve the distinction between neighboring features when signal levels permit.
Different grating and filter combinations cover different wavelength intervals, so observing the entire near-infrared range requires multiple setups. Exposure planning must account for source brightness and line strength within each interval. More spectral detail is useful only when the observation collects enough signal to measure that detail reliably.[22]
High-Resolution Spectroscopy
NIRSpec’s higher-resolution gratings provide nominal resolving power around 2,700. They are described as high resolution within the NIRSpec mode family, although specialized ground-based spectrographs can reach much higher resolving powers. These settings help separate blended features and study gas kinematics. As an approximate scale, c divided by R is about 110 kilometers per second at R of 2,700, but that is a resolution-element scale, not a guaranteed velocity-measurement error. Calibration, signal strength, and source structure determine practical precision.[22]
What Is NIRSpec Bright Object Time-Series Mode?
Bright Object Time-Series spectroscopy, abbreviated BOTS, repeatedly measures a bright source through the 1.6 by 1.6 arcsecond S1600A1 aperture. Its relatively large opening reduces sensitivity to modest placement changes compared with narrower slits. The mode is particularly useful for exoplanet transits and eclipses, where small wavelength-dependent brightness changes must be measured through time.
Suitable detector subarrays and readout settings help avoid saturation. Observations need an adequate baseline outside the event to distinguish the astrophysical signal from instrumental trends and stellar variability.[31][32]
Mid-Infrared Instrument: MIRI
MIRI extends Webb into wavelengths beyond those covered by its near-infrared instruments. Its nominal overall science range is approximately 4.9–27.9 µm, with imaging, coronagraphy, integral field spectroscopy, low-resolution spectroscopy, and now wide-field slitless spectroscopy. These wavelengths contain thermal emission and many useful molecular and solid-state features.
MIRI therefore adds information about dusty environments and planetary systems that near-infrared observations cannot supply alone. Its detectors require a dedicated cryocooler because passive cooling does not reach their necessary operating temperature.[4][33][34]
What Is MIRI and Why Is It Important?
The Mid-Infrared Instrument measures radiation at longer wavelengths than NIRCam, NIRSpec, and NIRISS. These observations help separate emission from dust, molecules, and cooler objects from the light of hotter stellar populations.
Mid-infrared does not mean every source observed is extremely cold: warm dust and young planets can be prominent, while very cold material may peak beyond Webb’s range. MIRI’s scientific value lies in accessing different radiation processes and diagnostic features, rather than simply producing a longer-wavelength version of the same near-infrared image.[4]
How Does MIRI Detect Mid-Infrared Radiation?
MIRI uses arsenic-doped silicon impurity-band-conduction detectors, written Si:As IBC. Three arrays serve the imager and two spectrograph detector channels, each with about 1,024 by 1,024 pixels. Their material properties allow detection at wavelengths where the near-infrared HgCdTe arrays are unsuitable for Webb’s requirements.
Incident radiation produces an electrical response that is sampled and calibrated. Detector behavior includes effects such as dark current, persistence, and nonlinearity, so a raw signal cannot be interpreted as a precise astronomical brightness without corrections.[35][36]
How Does MIRI Perform Mid-Infrared Imaging?
MIRI’s conventional imaging mode uses selected filters with nominal central wavelengths from 5.6 to 25.5 µm. Its unobstructed imaging field is approximately 74 by 113 arcseconds, sampled at about 0.11 arcseconds per pixel. These imaging-filter wavelengths differ from the instrument’s full spectroscopic envelope.
Images trace dusty structures, embedded sources, and planetary thermal emission, depending on the passband. At longer wavelengths, diffraction spreads a point source over a larger angular area, so MIRI images generally resolve coarser structure than short-wavelength NIRCam images.[4][37]
What Is the MIRI Medium Resolution Spectrometer?
The Medium Resolution Spectrometer, or MRS, supplies integral field spectroscopy across four channels. Their fields increase from about 3.2 by 3.7 arcseconds to 6.6 by 7.7 arcseconds. All channels operate together, but a single setting covers only part of each channel’s wavelength range.
Three settings are required for full nominal coverage. Resolving power is broadly around 1,500–3,500, with more detailed band-specific values and source-dependent performance. Its data cubes reveal spatial variations in gas lines, molecular emission, and dust features.[38]
What Is the MIRI Low Resolution Spectrometer?
The Low Resolution Spectrometer, or LRS, uses a double prism to disperse approximately 5–14 µm light, with resolving power near 100 at 7.5 µm. It supports a slit configuration and a slitless configuration suited to time-series work. Broad molecular bands and continuum shapes are natural targets for this mode.
Its nominal wavelength envelope should not be confused with uniform sensitivity: practical precision depends on source brightness, throughput, background, and detector behavior at each wavelength. Observers must assess the useful range for their particular target.[39][37]
How Do MIRI Coronagraphs Work?
MIRI includes three four-quadrant phase-mask coronagraphs centered near 10.65, 11.4, and 15.5 µm, plus a Lyot coronagraph near 23 µm. Phase masks manipulate the phase of starlight so much of it can be rejected by downstream optics. The Lyot system instead uses an occulting configuration with a pupil stop. Both require careful target placement and residual-starlight calibration.
Their scientific applications include selected planetary companions and circumstellar dust. Performance varies with wavelength, separation, source spectrum, and the quality of reference observations.[4][40]
Why Does MIRI Require Cryogenic Cooling?
A warm detector and its surroundings can generate signals that compete with faint astronomical infrared light. MIRI’s longer-wavelength detectors are particularly demanding, so an electrically powered cryocooler brings them to below about 7 kelvin. The sunshield and passive cooling establish a cold environment, but additional active refrigeration is necessary for MIRI.
This reduces detector dark current and instrument thermal effects. It does not remove every background source: radiation from the sky and the telescope still contributes, and those signals must be included in exposure estimates.[34]
What Astronomical Objects Can MIRI Study?
MIRI observes dusty galaxies, star-forming regions, protoplanetary disks, selected exoplanets, brown dwarfs, and Solar System objects. Its spectra can trace molecular gas and features produced by dust grains, while imaging maps their distribution.
The useful target set depends on brightness and observing configuration. For example, warm material may be conspicuous in the mid-infrared even when stars appear comparatively faint. Conversely, the coldest outer disk material often requires longer-wavelength facilities. Combining MIRI with near-infrared and millimeter observations provides a more complete physical picture.[4][41]
What Does MIRI Wide-Field Slitless Spectroscopy Add?
Current documentation includes MIRI wide-field slitless spectroscopy, an important addition to older summaries of the instrument. This mode places the P750L double prism in the imager’s optical path to obtain approximately 5–14 µm spectra across its unobstructed 74 by 113 arcsecond field. Resolving power is around 100, referenced near 7.5 µm. Multiple objects can therefore be dispersed in one observation. As with other slitless modes, overlapping spectra, source positions, and background affect interpretation, and observers should check the current calibration guidance.[33]
Near-Infrared Imager and Slitless Spectrograph: NIRISS
NIRISS supplies observing techniques that complement NIRCam and NIRSpec within an overall envelope of about 0.6–5.0 µm. Its four mode families are conventional imaging, wide-field slitless spectroscopy, single-object slitless spectroscopy, and aperture masking interferometry.
Those modes use different wavelength intervals and optical configurations. NIRISS is part of Canada’s contribution to Webb and shares an instrument package with FGS, while remaining a separate optical system. Its strengths include stable spectra of bright stars and measurements of objects separated by small angles.[5][42]
What Is NIRISS?
The name NIRISS expands to Near-Infrared Imager and Slitless Spectrograph. Unlike an instrument built around narrow entrance slits, it uses dispersive elements that spread sources directly across its detector. It can also record undispersed images and interference patterns.
These options make its capabilities broader than its name alone suggests. NIRISS is especially useful when the scientific question benefits from a bright-source spectrum, a survey of many dispersed objects, or specialized measurements of close companions rather than NIRCam’s finer conventional imaging pixels.[42][43]
How Does NIRISS Slitless Spectroscopy Work?
Slitless spectroscopy disperses light without first restricting each source to an entrance slit. Every source admitted by the optical configuration can therefore produce a spectral trace. This avoids losses caused by a target drifting within a narrow slit, but it introduces other complications.
Nearby sources and different spectral orders may overlap, while background light is also dispersed. Accurate source positions and models of trace shapes help separate the contributions. The method’s efficiency is greatest when field crowding and the selected wavelength coverage suit the observing goal.[44][45]
What Is NIRISS Single-Object Slitless Spectroscopy?
Single-Object Slitless Spectroscopy, or SOSS, obtains approximately 0.6–2.8 µm spectra of a bright target using a cross-dispersing grism. Its characteristic resolving power is about 700 near 1.4 µm, with performance varying across the spectrum and orders. Repeated observations track changes during transits or eclipses.
A deliberately broadened spectral profile distributes light over more detector pixels, helping bright-source measurements. Practical planning still requires checks for saturation, overlapping orders, nearby contaminating stars, and appropriate target acquisition before the science sequence begins.[46][47]
How Does NIRISS Perform Wide-Field Slitless Spectroscopy?
Wide-Field Slitless Spectroscopy, abbreviated WFSS, provides low-resolution spectra across approximately 0.8–2.2 µm and a field about 133 by 133 arcseconds. Resolving power is approximately 150 near 1.4 µm. Two grisms disperse light in perpendicular directions, helping distinguish overlapping traces and associate features with the correct objects. Direct images provide source positions and morphological information.
This combination supports emission-line galaxy surveys and redshift measurements, although source size and contamination can reduce the spectral information recoverable for individual objects in crowded fields.[44][48]
What Is Aperture Masking Interferometry?
Aperture Masking Interferometry, or AMI, places a mask with seven holes in the pupil, creating an interferometric array within Webb’s aperture. Each pair of holes defines a unique baseline, producing measurable interference fringes.
Their properties constrain close companions and compact structure. NIRISS AMI uses selected filters near 2.8, 3.8, 4.3, and 4.8 µm, with performance dependent on wavelength and calibration. It offers specialized angular discrimination for bright targets, but transmits much less light than the full aperture and does not replace ordinary wide-field imaging.[49][50]
What Are the Scientific Applications of NIRISS Imaging?
NIRISS conventional imaging uses filters spanning approximately 0.8–5.0 µm over its full detector field, sampled at roughly 0.066 arcseconds per pixel. It supports direct images associated with slitless spectroscopy and can provide prime or supported parallel science imaging.
This makes it useful for source characterization, surveys, and additional coverage around other observations. Current documentation supports full-frame science imaging; subarray imaging is reserved for engineering or calibration. Its coarser sampling and single field distinguish it from NIRCam’s simultaneous two-channel, two-module imaging design.[51][52]
Fine Guidance Sensor: How Webb Maintains Precise Pointing
FGS measures guide-star positions so Webb can maintain stable pointing during observations. Its role underpins imaging, spectroscopy, and time-series measurements, but it does not collect general-observer science in the same sense as the four science instruments.
This distinction also separates three concepts often confused in telescope descriptions: acquiring the correct target position, holding the line of sight steady, and aligning the telescope mirrors. FGS principally supports the second, while acquisition procedures and wavefront sensing address the other tasks.[7][12][53]
What Is the Fine Guidance Sensor?
The Fine Guidance Sensor is a near-infrared camera system with two redundant guider channels. Each has a detector field approximately 2.3 by 2.3 arcminutes, with a smaller usable guide-star identification region of about 2.20 by 2.20 arcminutes. Its broad, unfiltered passband extends approximately 0.6–5.0 µm.
Those specifications serve reliable star detection rather than multi-filter science imaging. Canada’s contribution includes FGS and NIRISS, but their functions remain separate: FGS guides the observatory while NIRISS collects science through its specialized observing modes.[7][42]
How Does FGS Track Guide Stars?
The guidance sequence identifies a suitable star, acquires it, and transitions through tracking into fine guiding. Repeated position measurements reveal departures from the desired location. The observatory’s attitude-control system uses this information to correct pointing, including through the fine steering mirror for rapid adjustments.
Good guiding depends on the star’s properties and field configuration, so guidance is a planned part of an observation. A precise number for stability must specify the relevant timescale and statistic rather than mixing guider centroid precision with observatory pointing performance.[53]
Why Is Accurate Telescope Pointing Essential?
Unwanted motion redistributes a target’s light across detector pixels and instrument apertures. In images it can broaden structure; in spectroscopy it can change transmitted flux or alter how a source illuminates the slit. Time-series observations are particularly sensitive because tiny instrumental changes can resemble astrophysical brightness variations.
Stable guiding therefore supports sharp images and reproducible measurements. It does not eliminate all systematic errors, since detectors, thermal changes, and the source itself can vary. Calibration and analysis must still test whether measured changes are astronomical.[53][54]
What Is the Difference Between FGS and NIRISS?
FGS and NIRISS share a Canadian-built package but have separate optical channels and responsibilities. FGS measures a guide star to help maintain the observatory’s line of sight. NIRISS uses filters, grisms, and an aperture mask to investigate astronomical targets.
Their shared packaging explains why names such as FGS/NIRISS appear in mission descriptions. It does not mean their detector images are interchangeable, that they observe the same sky position, or that guiding counts as a fifth general-observer science mode.[42]
Infrared Astronomy: Why Webb Observes in Infrared Light
Infrared observations connect several major themes in modern astronomy. Cosmic expansion shifts much early-galaxy radiation to longer wavelengths, dust obscures many regions at visible wavelengths, and planets or dust grains emit thermal radiation that can be strong in the infrared. Webb’s wavelength range therefore serves multiple scientific needs rather than a single mechanism.
The near-infrared and mid-infrared instruments probe different mixtures of stellar light, gas features, molecular bands, and dust emission, making their measurements complementary rather than redundant.[20][4][55]
What Is Infrared Astronomy?
Infrared astronomy studies electromagnetic radiation beyond the red end of ordinary human vision. Its wavelength divisions are conventions rather than universal boundaries, and instruments cover selected parts of that larger spectrum. Webb reaches from the red edge of visible light into the mid-infrared, rather than covering every infrared wavelength.
Observing from space avoids much of the absorption and thermal background associated with Earth’s atmosphere. The observatory still needs careful thermal design, sensitive detectors, and calibration because moving above the atmosphere does not remove all background radiation.[1][56]
What Are Near-Infrared Wavelengths?
For Webb’s science suite, near-infrared capabilities are concentrated around 0.6–5.3 µm, although the shortest part overlaps visible red light and definitions of infrared subregions vary. NIRCam, NIRSpec, and NIRISS sample this territory through different modes.
Redshifted ultraviolet and visible radiation from early galaxies can arrive here. Near-infrared light can also pass through many dusty environments more effectively than visible light. However, neither redshift nor dust transparency is a property of an instrument alone: the source spectrum and intervening material determine what becomes observable.[2][3][5][55]
What Are Mid-Infrared Wavelengths?
MIRI supplies Webb’s mid-infrared observations across a nominal useful envelope near 4.9–27.9 µm. This region contains thermal emission from warm material, molecular transitions, and solid-state features associated with dust. It can make a dusty structure conspicuous even when stars dominate the near-infrared view.
The longest wavelength is not an abrupt physical wall: detector response declines, and older summaries sometimes quote a longer design limit. For practical science planning, the current mode-specific throughput, calibration, and sensitivity information is more meaningful than a single rounded endpoint.[4][38][57]
How Does Infrared Light Reveal Hidden Astronomical Objects?
Dust grains absorb and scatter radiation in ways that depend on wavelength, grain composition, and geometry. Many clouds block visible starlight more strongly than near-infrared light, letting Webb reveal embedded populations. Dust also absorbs energy and radiates at infrared wavelengths, so the obscuring material itself becomes measurable.
These processes should be distinguished: seeing through a cloud and detecting its emission provide different evidence. Dense regions can remain opaque even in the infrared, making multiwavelength observations essential for reconstructing the physical environment.[20][21][41]
JWST Spectroscopy: How Instruments Analyze Light
Spectroscopy distributes a source’s light by wavelength so astronomers can inspect features that broad imaging filters blend together. All four Webb science instruments provide some spectroscopic capability, but their available apertures, wavelength coverage, resolving powers, and target suitability differ.
A galaxy survey may prioritize many simultaneous spectra, while a planetary transit needs repeated stable measurements of one star. This is why choosing a spectrograph involves the entire observing mode rather than merely asking which instrument has the highest nominal resolution.[9][22][45][56]
What Is Spectroscopy in Astronomy?
An astronomical spectrum measures light intensity as a function of wavelength. Smooth continuum emission may come from stars, dust, or other processes, while absorption and emission features arise when matter interacts with radiation at particular energies.
The pattern can constrain which substances are present and the conditions under which they emit or absorb. Interpretation is not always unique: temperature, density, optical depth, and geometry can change feature strengths. Reliable analysis therefore compares several features and models instead of treating every peak as a direct abundance measurement.[22][56]
How Do Diffraction Gratings and Grisms Work?
A diffraction grating uses repeated structures to send different wavelengths in different directions through interference. A grism combines a grating with a prism, allowing useful dispersion within an instrument’s optical layout. NIRSpec uses gratings and a prism; NIRCam and NIRISS have grism modes.
MIRI MRS uses grating-based spectrograph channels, while its low-resolution system uses a double prism. These distinctions matter because dispersion, spectral orders, throughput, and wavelength coverage depend on the optical design. Instruments do not all separate wavelengths through the same mechanism.[17][22][37][46]
What Is the Difference Between Slitless and Fixed-Slit Spectroscopy?
Fixed-slit spectroscopy restricts incoming light to a narrow sky region before dispersion, reducing unwanted contributions but introducing placement-sensitive slit losses. Slitless spectroscopy admits a larger field, allowing many sources to be dispersed while increasing overlap and background complications. NIRSpec fixed slits and MIRI LRS slit observations illustrate the first approach.
NIRISS WFSS and SOSS, NIRCam grism modes, and MIRI slitless modes illustrate the second. Neither approach always wins: crowding, source brightness, target motion, and the required stability determine which trade-offs are acceptable.[26][39][45][56]
How Does Integral Field Spectroscopy Work?
Integral field spectroscopy preserves information about two sky coordinates while dispersing the light from each spatial element. In Webb’s image-slicer systems, sections of the field are rearranged into a format the spectrograph can record. Calibration reconstructs a cube with a spectrum at each spatial location.
NIRSpec IFU covers a small near-infrared field, while MIRI MRS supplies longer-wavelength cubes with channel-dependent footprints. Researchers can compare line maps, continuum structure, and kinematics, provided they account for spatial sampling, point-spread functions, and reconstruction effects.[28][29][58]
What Is Spectral Resolution?
Spectral resolving power is defined as R = λ/Δλ, where Δλ represents the width of a resolution element near wavelength λ. A larger R separates more closely spaced features. This differs from the number of detector samples and from the precision of a fitted line position. Increasing resolution distributes continuum light among more elements and can require longer exposures for a desired precision per element. Yet resolved emission lines may benefit from reduced background per feature. The best resolution therefore depends on the target spectrum and scientific measurement.[22][38]
How Are Spectra Used to Measure Astronomical Properties?
Scientists identify patterns of lines or bands and compare their observed wavelengths with laboratory values. A consistent shift can establish redshift, while line ratios and continuum shapes constrain temperature, density, ionization, and composition.
For cosmological redshift, observed wavelength equals emitted wavelength multiplied by one plus z. Within a source, relative line shifts can reveal gas motions. These deductions carry uncertainties from noise, calibration, blends, and the physical model. A robust result often relies on multiple mutually consistent features rather than one ambiguous signal.[22][30][55]
JWST Imaging: How Infrared Pictures Are Produced
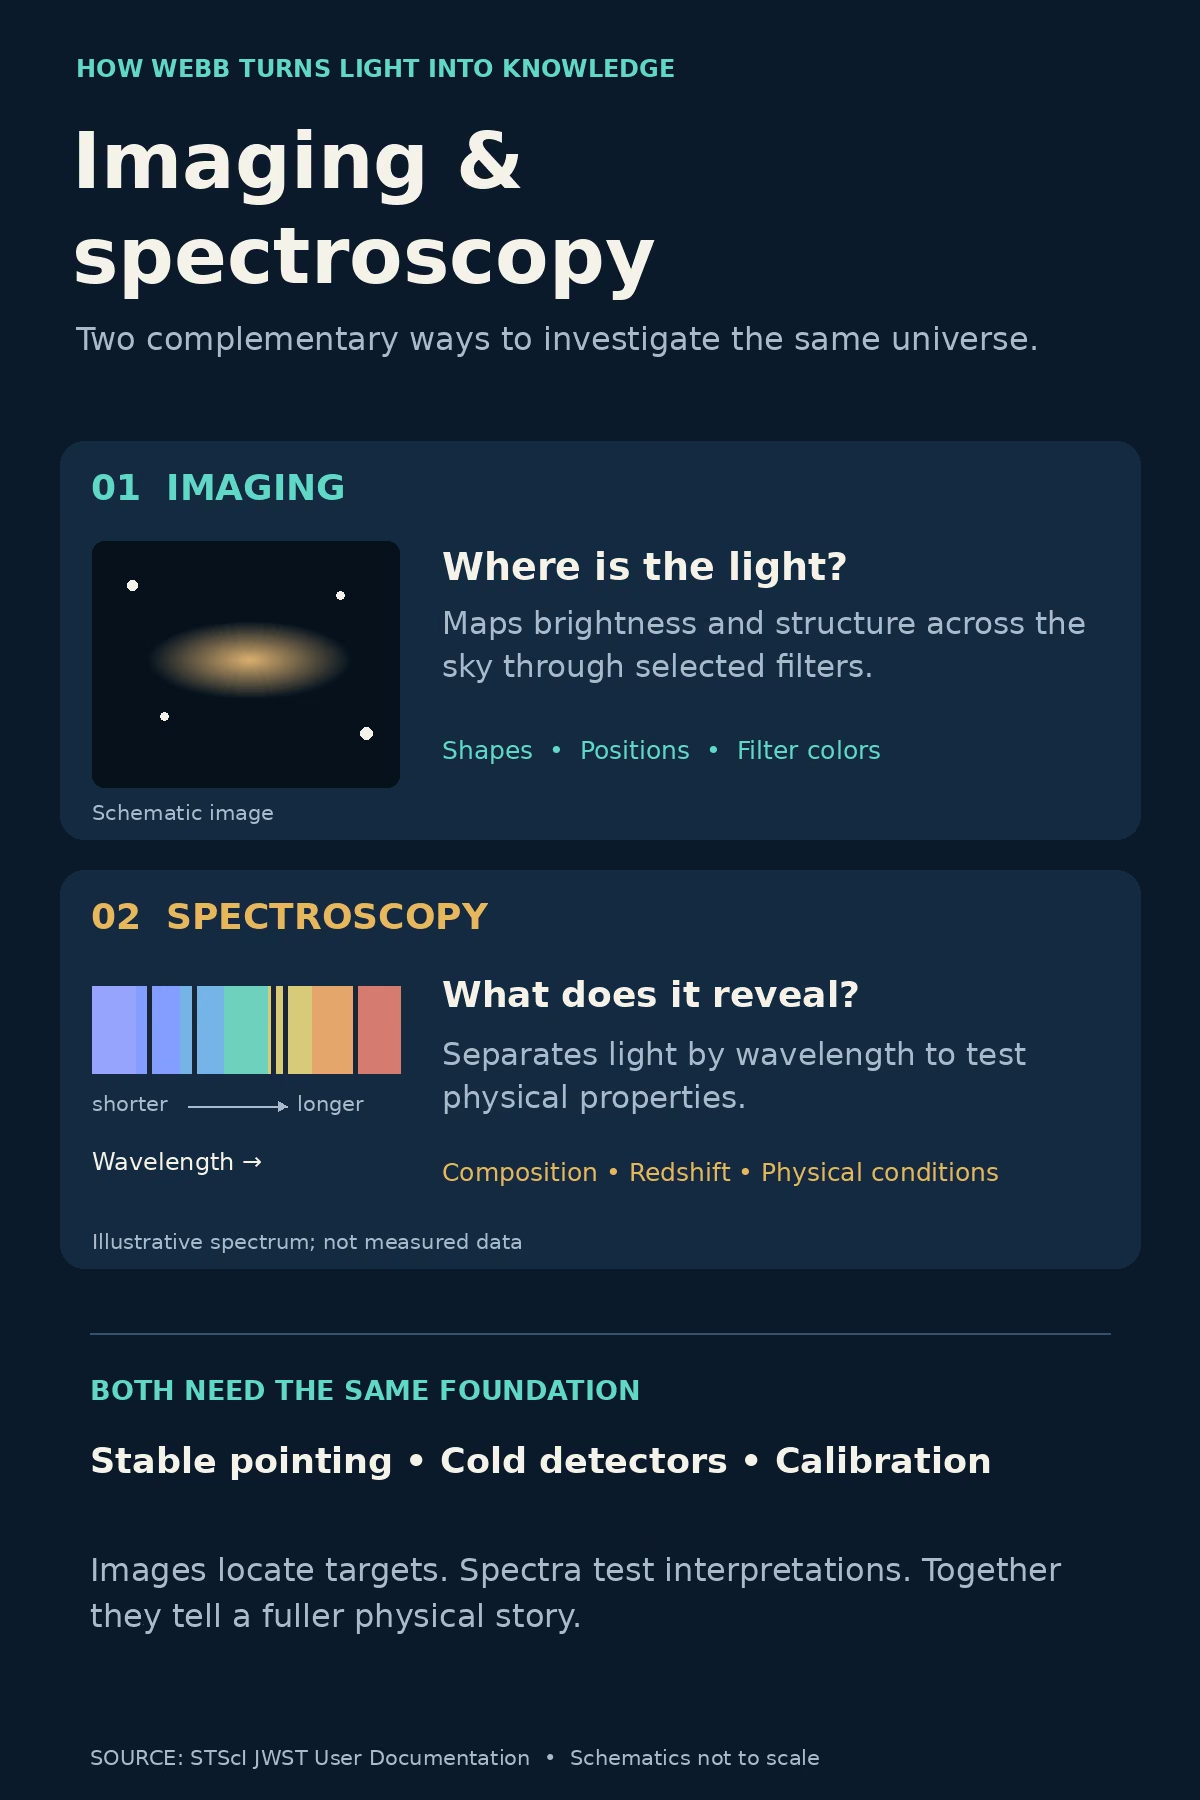
A Webb image begins as detector measurements collected through a defined optical configuration, not as a ready-made color photograph. Calibration removes or models instrumental effects, assigns sky coordinates, and relates signal to brightness. Multiple exposures may then be aligned and combined to improve coverage and sampling. Scientific analysis uses these calibrated measurements with their uncertainties. Public color images add a display stage that maps infrared information into visible hues, allowing people to inspect structures they could not see directly with their eyes.[13][59][60]
How Does Infrared Imaging Work?
Infrared photons reaching a detector produce an electrical response that accumulates during an integration. Pixel arrays sample the focal-plane image, while filters select the wavelength interval contributing to each measurement. Repeated readings help estimate signal rates and identify problems such as cosmic-ray events.
Calibrated exposures can be combined after correcting optical distortion and aligning their sky coordinates. The final image’s usefulness depends on signal-to-noise ratio, sampling, detector behavior, and the telescope’s point-spread function. Longer exposure improves some limitations but cannot remove every artifact or resolve arbitrarily fine structure.[13][14][61]
What Is Spatial Resolution?
Spatial resolution describes the ability to distinguish nearby structures on the sky. For a diffraction-limited telescope, the characteristic angular scale grows approximately as wavelength divided by aperture diameter. Webb’s 6.5-meter primary mirror therefore produces narrower point-source patterns at shorter wavelengths. Pixel scale also matters because a detector must sample that pattern adequately.
Resolution should not be confused with sensitivity or field of view. A faint source can be detected without its internal structure being resolved, and a larger image file does not itself provide finer astronomical detail.[62][63]
What Is an Instrument’s Field of View?
Field of view is the angular area recorded in a particular observation. NIRCam’s two imaging modules together cover approximately 9.7 square arcminutes with gaps; NIRISS provides a single field around 2.2 by 2.2 arcminutes. MIRI’s conventional unobstructed imaging field is about 74 by 113 arcseconds.
These footprints determine survey efficiency and how many pointings are needed for extended targets. Larger mosaics combine adjacent observations, while dithers use smaller offsets to improve sampling or fill gaps. Spectroscopic apertures often have very different fields from their instrument’s imaging footprint.[8][13][51]
How Do Optical Filters Affect JWST Images?
Filters transmit chosen wavelength intervals, allowing astronomers to compare different physical components of a source. Broad filters collect substantial continuum signal, medium filters isolate narrower spectral regions, and narrow filters can emphasize selected emission features where suitable passbands exist. Filter choice also changes background and saturation behavior.
A bright patch in one filter could reflect a line, continuum emission, or several contributions together. Interpreting it requires knowledge of the source’s spectrum and redshift, so assigning one physical meaning to every filter without context can be misleading.[11][37][64]
How Are JWST Images Assigned Visible Colors?
Most Webb observations measure wavelengths outside ordinary human vision. To create a color display, image processors assign visible hues to calibrated images from different filters. A common approach gives shorter infrared wavelengths bluer colors and longer ones redder colors, while preserving useful distinctions among structures. Brightness scaling and contrast adjustments reveal a large dynamic range.
The underlying data remain quantitative measurements; display colors are a representation of them. Image captions and filter keys are essential because a red feature does not automatically indicate its visible appearance or temperature.[59]
JWST Detector Technologies: Turning Light into Data
Webb’s detectors translate radiation into electronic measurements that can be sampled, stored, transmitted, and calibrated. Near-infrared systems use HgCdTe arrays, while MIRI uses Si:As arrays tailored to longer wavelengths. Their performance depends on temperature, readout configuration, accumulated charge, and calibration.
Detector technology consequently affects which wavelengths can be measured and how observations must be planned. Understanding these devices also explains why raw images contain patterns unrelated to the sky and why carefully chosen exposure settings matter as much as total observing time.[14][35][65]
What Are Mercury Cadmium Telluride Detectors?
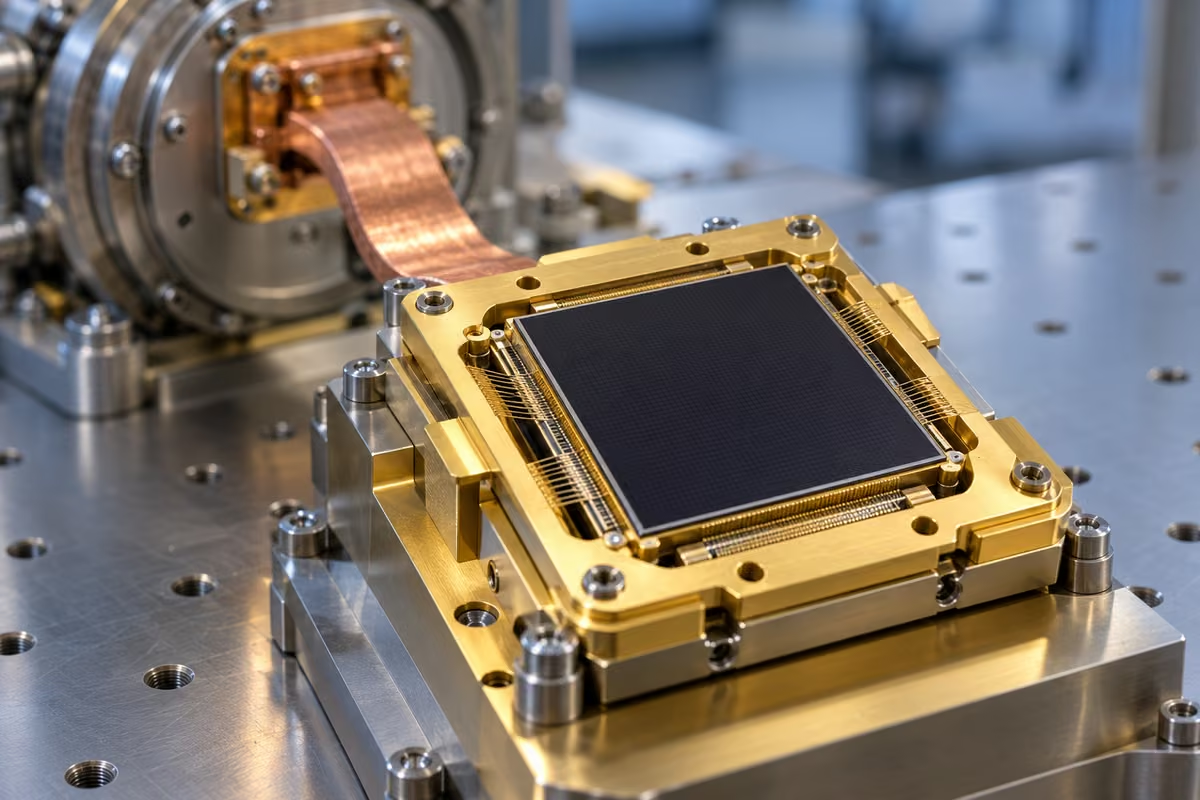
Mercury cadmium telluride, abbreviated HgCdTe, is a semiconductor material used in Webb’s near-infrared detector arrays. NIRCam, NIRSpec, NIRISS, and FGS employ this detector family, with configurations matched to their tasks. Absorbed photons create charge carriers that can be measured electronically. Quantum efficiency describes how effectively incoming photons produce detected signal, while read noise and dark current contribute uncertainty. The common detector family does not imply identical behavior across instruments: material cutoff, optics, electronics, temperature, and readout methods all influence practical performance.[14][65][66]
What Are Arsenic-Doped Silicon Detectors?
Arsenic-doped silicon detectors introduce impurity states that allow response to longer-wavelength photons than ordinary silicon imaging detectors. MIRI uses the impurity-band-conduction implementation of this technology. Its arrays operate at temperatures far below those of household cameras to suppress unwanted thermal effects and achieve useful sensitivity. Their behavior differs from the HgCdTe near-infrared arrays, so MIRI requires its own detector corrections and observing strategies. Low operating temperature is one part of the system; optical background, electronic readout, and calibration also determine the final measurement quality.[35][36][34]
What Is a Focal Plane Array?
A focal plane array is a two-dimensional arrangement of light-sensitive pixels placed where an optical system forms an image. In imaging, different pixels correspond primarily to different positions on the sky. In spectroscopy, pixel coordinates encode a mixture of position and wavelength according to the optical configuration. Not every pixel is necessarily light sensitive: reference pixels can help track electronic behavior. Array dimensions alone therefore do not specify useful science area, angular resolution, or spectral resolution. Those depend on the complete instrument and its calibration.[14][36][66]
What Are Detector Readout Patterns?
Webb detectors commonly use nondestructive sampling, meaning accumulated signal can be measured repeatedly before the detector is reset. Frames may be combined or skipped according to a readout pattern. Saved samples form groups, groups belong to an integration, and one exposure can contain multiple integrations. The selected pattern affects cadence, noise, data volume, and saturation limits.
Faster subarray readout can help with bright targets, but records less detector area. Exact allowed combinations are instrument- and mode-specific, so planning must use the current templates and exposure calculator.[61][67]
What Causes Background Noise in JWST Observations?
Noise comes from several physically different sources. Photon statistics affect both the target and background radiation. Zodiacal dust, Galactic emission, and thermal radiation from the observatory contribute unwanted photons. Detectors add dark current and electronic read noise, while instrumental patterns can introduce correlated errors.
Subtracting an average background removes its level but not the photon noise already generated by it. Exposure planning therefore models the background as part of the uncertainty budget, and precision work must also examine residual systematic effects in the calibrated data.[54][68][69]
How Does Cryogenic Cooling Improve Infrared Detection?
Cooling lowers unwanted thermal signals and helps establish stable detector behavior. Webb’s sunshield allows the telescope and near-infrared instruments to radiate heat into space, while MIRI needs additional active cryocooling. Different components operate at different temperatures because their physical requirements differ.
Lower temperature does not automatically improve every measurement without limit: design constraints, operating stability, and detector characteristics matter. The goal is a controlled thermal environment in which faint astronomical signals can be separated from instrument effects using calibration and appropriate background measurements.[34][70]
JWST Observing Modes: Choosing the Right Configuration
An observing mode specifies how an instrument accepts light, selects wavelengths, reads its detectors, and organizes measurements. The same hardware can serve quite different goals when configured for an image, a spectrum, or a time series. Mode selection therefore comes before detailed exposure settings. Astronomers must decide whether they need spatial structure, chemical diagnostics, brightness changes, or several of these together.
The chosen configuration then determines acquisition needs, saturation limits, field coverage, calibration requirements, and the feasibility of combining the observation with other measurements.[71][72]
What Are the Main JWST Observing Modes?
Webb’s science modes include conventional imaging, fixed-slit spectroscopy, microshutter multi-object spectroscopy, integral field spectroscopy, slitless spectroscopy, coronagraphy, aperture masking interferometry, and time-series observations.
These labels describe different dimensions of an observation and can overlap. For example, NIRSpec BOTS is both spectroscopy and a time series, while MIRI MRS provides spatially resolved spectra rather than an ordinary image. Not every mode exists on every instrument. Selecting a mode requires checking the relevant instrument template and the capabilities offered in the applicable proposal cycle.[71][72][73]
What Is Time-Series Spectroscopy?
Time-series spectroscopy repeatedly measures a target’s spectrum so changes can be tracked at individual wavelengths. During an exoplanet transit, each wavelength channel produces a light curve, and fitting those curves yields a transmission spectrum. Eclipses and orbital phase variations can instead constrain planetary emission.
Repetition introduces demands beyond a single spectrum: consistent detector placement, accurate timing, suitable cadence, and an adequate baseline are essential. Analyses also need to distinguish instrument trends and stellar variability from the event being studied, rather than assuming every change is planetary.[32][54][74]
What Is Time-Series Imaging?
Time-series imaging records a succession of images through a selected filter, producing brightness measurements as a function of time. Astronomers use these light curves for transits, eclipses, rotational variability, occultations, and other changing phenomena.
Compared with spectroscopy, a broad imaging band combines photons across a wider interval, which can improve measurement precision while sacrificing wavelength detail. The useful cadence depends on detector readout and integration settings. Accurate photometry also requires consistent background treatment, aperture corrections, timing, and checks for saturation or changing source placement.[19]
How Do Astronomers Select an Observing Mode?
A practical sequence starts with the quantity to be measured and the precision required. Astronomers then identify diagnostic wavelengths, estimate source brightness and angular size, and decide whether spatial or spectral detail is essential. They compare suitable modes using the Exposure Time Calculator, or ETC, before translating settings into APT.
This process should include saturation, background, contamination, acquisition, and scheduling checks. A mode with impressive headline specifications can still be a poor choice if it misses the necessary feature or cannot handle the target’s brightness.[75][76]
How JWST Instruments Study Exoplanet Atmospheres
Webb studies exoplanets through several different observing geometries. A transit reveals wavelength-dependent changes in starlight passing through a planet’s atmospheric edge. An eclipse can isolate the planet’s contribution to the combined light, and phase curves track changes during an orbit. Direct imaging separates selected companions spatially from their host stars.
These methods favor different targets and answer different questions. The combination of near-infrared and mid-infrared measurements can constrain atmospheric chemistry and temperature, but conclusions depend on data quality, models, and alternative explanations.[31][46][77]
What Is Exoplanet Transit Spectroscopy?
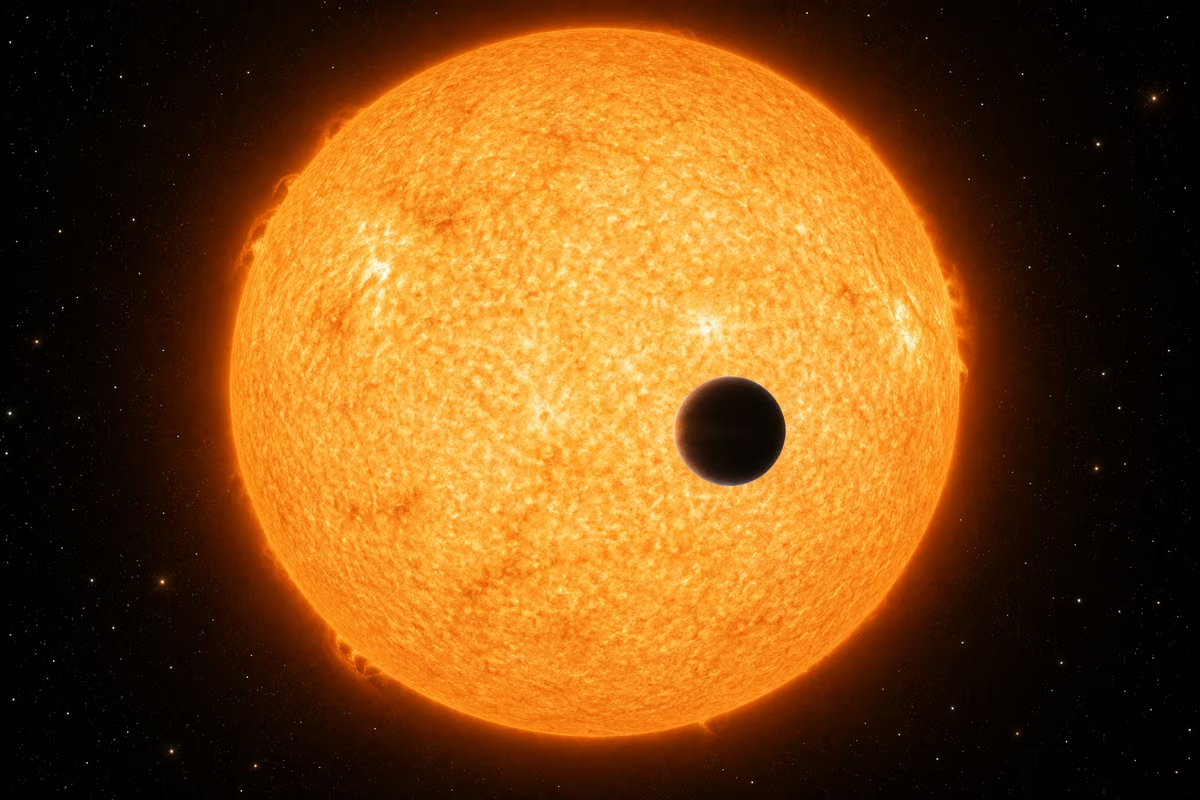
During a transit, a planet blocks part of its star. An atmosphere can absorb extra starlight at particular wavelengths, making the apparent transit depth vary across the spectrum. Comparing spectra before, during, and after the event yields a transmission spectrum. The measurement usually does not spatially resolve the atmosphere; it infers its effects from tiny brightness differences. Clouds, hazes, stellar spots, and measurement systematics can alter the result. Repeated events and broad wavelength coverage help test whether an inferred atmospheric feature is robust.[32][46][54]
Which JWST Instruments Are Used for Transit Spectroscopy?
Common transit-spectroscopy configurations include NIRISS SOSS, NIRSpec BOTS, NIRCam grism time series, and MIRI LRS slitless observations. They cover different wavelength intervals and brightness regimes. NIRCam’s short-wavelength DHS capability adds another option within supported configurations.
Selection requires an assessment of the host star’s brightness and the desired molecular bands, along with saturation and readout constraints. Combining instruments can broaden the atmospheric picture, but separate visits may introduce stellar variability and calibration offsets that must be tested before treating their spectra as one seamless measurement.[18][31][39][46]
How Do Scientists Identify Molecules in Exoplanet Atmospheres?
Researchers compare observed spectral patterns with predictions from atmospheric models containing candidate molecules. Water vapor, carbon dioxide, methane, and other species have characteristic bands, but detectability depends on abundance, temperature, clouds, wavelength coverage, and noise.
Retrieval models estimate which combinations of parameters are consistent with the measurements. Multiple bands and independent observations can strengthen an interpretation. A molecular detection is not automatically evidence of life, and a missing feature does not necessarily establish the absence of an atmosphere or the molecule in question.[77][78][79]
How Does Coronagraphy Complement Transit Spectroscopy?
Transit spectroscopy needs a favorable orbital alignment and measures the atmosphere through changes in unresolved star-plus-planet light. Coronagraphy instead suppresses the star so a sufficiently separated companion can be measured directly. NIRCam and MIRI therefore access selected systems that need not transit.
Their images and photometry can constrain companion luminosity and atmospheric models, particularly for young, warm giant planets. The two approaches probe different populations and viewing geometries. Direct imaging also remains limited by angular separation, residual starlight, and the companion’s intrinsic brightness.[15][40]
Comparing NIRCam, NIRSpec, MIRI, NIRISS, and FGS
The most useful comparison separates purpose, wavelength, field coverage, and observing mode. A camera’s full field is not comparable to a spectrograph’s narrow slit, and an instrument’s overall wavelength range does not describe every setting. Likewise, guidance images are operational products rather than a general science-imaging service.
The tables below therefore identify nominal fields or apertures explicitly and distinguish conventional imaging from acquisition or guidance. Resolving powers are representative values, with wavelength and configuration dependencies noted rather than reduced to one universal number.[2][3][4][5][7]
Which JWST Instruments Capture Images?
NIRCam, MIRI, and NIRISS provide science imaging, but they differ in wavelength, sampling, and field coverage. NIRCam is the main near-infrared survey imager, MIRI reveals mid-infrared emission, and NIRISS supplies complementary direct imaging alongside its specialized modes. NIRSpec also forms acquisition images, while FGS images guide stars for tracking.
Those operational images should be kept distinct from proposal-ready science imaging modes. Even among the science imagers, the best choice depends on the physical component being studied rather than which instrument name appears on the sharpest publicity image.[3][51][60]
Which JWST Instruments Perform Spectroscopy?
All four science instruments have spectroscopic modes. NIRSpec offers selected-target spectra through microshutters, fixed slits, and an IFU. NIRISS specializes in slitless modes at shorter near-infrared wavelengths, with SOSS for bright-source time series and WFSS for surveys. NIRCam’s grisms cover longer near-infrared survey and time-series work, with DHS adding short-wavelength time series.
MIRI provides low-resolution and integral field mid-infrared spectra, plus wide-field slitless spectra. Comparing them requires the wavelength of the feature, source size, crowding, and precision needed for the actual science.[17][22][33][43]
Which Instruments Can Observe Exoplanets?
Each science instrument contributes to exoplanet research through suitable modes. NIRISS, NIRSpec, NIRCam, and MIRI support atmospheric or time-variable measurements, while NIRCam and MIRI offer coronagraphy. NIRISS AMI adds specialized close-companion measurements for suitable bright targets.
This does not imply that every planet is accessible to all four instruments. A transiting system may be too bright for one configuration or too faint for useful mid-infrared spectra, while a directly imaged companion may be too close to its star for effective glare suppression.[31][39][46][49][15]
Which Instruments Are Best for Studying Early Galaxies?
NIRCam is central to finding candidate early galaxies through deep imaging and color selection. NIRSpec can confirm redshifts and measure spectral features, while NIRISS WFSS supplies spectra across selected fields at shorter near-infrared wavelengths. MIRI adds longer-wavelength measurements for sufficiently detectable galaxies, helping constrain stellar and dust components.
No instrument independently settles every question about an early galaxy. Photometric candidates require careful assessment, spectroscopic measurements carry their own uncertainties, and interpreting age or mass depends on assumptions about stars, gas, dust, and star-formation history.[30][48][55][80]
JWST Instrument Comparison Table
The first table summarizes functions, while the second records representative mode specifications. Fields are angular dimensions on the sky; one arcminute equals 60 arcseconds. A quoted spectral range is a mode envelope rather than a promise that every detector placement records every wavelength without gaps.
MRS resolving power is often summarized near 1,500–3,500, but its detailed channel table spans roughly 1,330–3,750. These distinctions explain why rounded overview numbers and detailed technical values can differ without describing fundamentally different instruments.[13][22][38][43]
| Comparison factor | NIRCam | NIRSpec | MIRI | NIRISS | FGS |
|---|---|---|---|---|---|
| Primary purpose | Near-infrared imaging and selected spectroscopy | Near-infrared spectroscopy | Mid-infrared imaging and spectroscopy | Specialized near-infrared imaging and spectroscopy | Guidance and calibration |
| Overall nominal envelope | 0.6–5.0 µm | 0.6–5.3 µm | 4.9–27.9 µm | 0.6–5.0 µm | About 0.6–5.0 µm, unfiltered |
| Conventional science imaging | Yes | Acquisition imaging only | Yes | Yes | Guidance images only |
| Science spectroscopy | Yes | Yes | Yes | Yes | No |
| Conventional coronagraphy | Yes | No | Yes | No; AMI is distinct | No |
| Representative applications | Galaxies, stars, disks, exoplanets | Redshift, composition, gas dynamics, transit spectra | Dust, molecules, disks, thermal emission | Transits, surveys, close companions | Stable pointing |
| Instrument and mode | Nominal wavelength coverage | Field or entrance aperture | Representative resolving power |
|---|---|---|---|
| NIRCam short-channel imaging | 0.6–2.3 µm | Two approximately 132″ × 132″ module fields, with detector and intermodule gaps | Not applicable to direct imaging |
| NIRCam long-channel imaging | 2.4–5.0 µm | Two approximately 129″ × 129″ fields | Not applicable to direct imaging |
| NIRCam long-channel WFSS | 2.4–5.0 µm, filter-dependent | Up to both long-channel module fields; usable spectral coverage depends on position | About 1,600 near 4 µm; wavelength-dependent |
| NIRCam DHS time series | 0.6–2.3 µm envelope; throughput and spectral-order limits apply | Bright-target spectral subarrays | About 300 in first order |
| NIRSpec MOS | 0.6–5.3 µm envelope | MSA field about 3.4′ × 3.6′; individual shutter opening about 0.20″ × 0.46″ | Prism approximately 30–300; gratings nominally 1,000 or 2,700 |
| NIRSpec fixed slits | Configuration-dependent within 0.6–5.3 µm | Selected fixed slit, including narrow slit options | Same disperser families; aperture-dependent performance |
| NIRSpec IFU | Configuration-dependent within 0.6–5.3 µm | About 3″ × 3″ | Nominally 100, 1,000, or 2,700 |
| NIRSpec BOTS | Configuration-dependent within 0.6–5.3 µm | S1600A1, approximately 1.6″ × 1.6″ | Prism or supported medium/high-resolution gratings |
| MIRI direct imaging | Filter centers 5.6–25.5 µm | Unobstructed field about 74″ × 113″ | Not applicable to direct imaging |
| MIRI LRS | Approximately 5–14 µm | Slit about 0.51″ × 4.7″, or slitless target subarray | About 100 at 7.5 µm |
| MIRI WFSS | Approximately 5–14 µm | Unobstructed field about 74″ × 113″ | About 100 at 7.5 µm |
| MIRI MRS | 4.9–27.9 µm nominal useful envelope | Channel 1: 3.2″ × 3.7″; channel 2: 4.0″ × 4.8″; channel 3: 5.2″ × 6.2″; channel 4: 6.6″ × 7.7″ | Broadly 1,500–3,500; detailed band values vary |
| MIRI coronagraphy | Filter centers near 10.65, 11.4, 15.5, and 23 µm | Phase masks about 24″ × 24″; Lyot field about 30″ × 30″ | Not applicable to direct imaging |
| NIRISS conventional imaging | Approximately 0.8–5.0 µm through available filters | About 133″ × 133″ | Not applicable to direct imaging |
| NIRISS WFSS | Approximately 0.8–2.2 µm | About 133″ × 133″ | About 150 at 1.4 µm |
| NIRISS SOSS | Approximately 0.6–2.8 µm | Single bright-source spectral subarrays | About 700 at 1.4 µm |
| NIRISS AMI | Selected filters near 2.8, 3.8, 4.3, 4.8 µm | Standard subarray about 5.2″ × 5.2″; useful close-companion separation is a different quantity | Interferometric imaging, not a dispersive spectrum |
| FGS | Broad unfiltered response about 0.6–5.0 µm | Two 2.3′ × 2.3′ guider fields; usable identification region about 2.20′ × 2.20′ | No science spectroscopy |
JWST Instrument Calibration and Scientific Data Processing
Calibration turns detector counts into measurements that can support physical conclusions. It corrects known instrumental responses, assigns spatial and spectral coordinates, and estimates uncertainties. The process is not a cosmetic cleanup applied only to public images; it is essential for quantitative science.
Webb’s pipeline uses instrument-specific reference files, and updated calibration can improve previously observed data. Researchers therefore need to record the processing version and reference context when comparing results or attempting to reproduce a published measurement from archived observations.[60][81]
What Is Instrument Calibration?
Instrument calibration establishes how detector signals relate to incoming light and sky position. Corrections may address dark current, nonlinear response, sensitivity variations among pixels, and wavelength-dependent throughput. Spectroscopy also requires wavelength and aperture calibrations, while imaging needs accurate geometric distortion and photometric information.
Some effects are measured using dedicated calibration observations and others are modeled. Calibration includes uncertainty rather than guaranteeing an exact answer. Knowing the limits of a correction is especially important when a scientific claim depends on a small difference between filters, wavelengths, or observing visits.[60]
What Is the JWST Science Calibration Pipeline?
The calibration pipeline performs detector-level processing in Stage 1, instrument and mode calibration in Stage 2, and combined or specialized processing in Stage 3. STScI’s broader data-flow description also includes Stage 0, which turns spacecraft telemetry into uncalibrated files. These conventions explain references to either three calibration stages or four overall processing stages.
Outputs can include calibrated exposures, combined images, extracted spectra, and spectral cubes. The appropriate path depends on observing mode, and precision analyses may require additional checks beyond the standard automated products.[60][81]
How Does Calibration Improve Scientific Accuracy?
Calibration reduces biases that would otherwise be mistaken for astronomical structure or variability. A flat-field correction accounts for differing detector responses, wavelength calibration places spectral features correctly, and photometric calibration relates signal to brightness. Quality flags identify measurements that need caution.
Improved reference files can make observations from different dates more consistent, but results still retain statistical and systematic uncertainties. Reproducibility therefore requires preserving both the science inputs and the processing choices. Merely downloading a newer product does not demonstrate that every earlier scientific conclusion must change.[60][81][82]
What Is the Mikulski Archive for Space Telescopes?
The Mikulski Archive for Space Telescopes, or MAST, stores JWST observations and associated products. Users can search by target, position, program, instrument, and other metadata, then select raw or processed files appropriate to their analysis. Public data are available broadly, while observations under an exclusive access period require authorization.
That period depends on program and applicable policy, so it should not be assumed to be identical for every dataset. The archive also supports scripted access, making repeatable searches and larger scientific downloads possible.[83][84][85]
Planning Observations With JWST Instruments
An observation proposal must connect a defensible scientific goal with an executable instrument setup. That means more than choosing a target and requesting a long exposure. Astronomers need reliable coordinates, a brightness estimate or source model, an appropriate observing mode, and realistic precision calculations.
They must also consider acquisition, dithers, backgrounds, timing, orientation, and overheads. Current STScI documentation, the Exposure Time Calculator, and APT provide complementary parts of this workflow. Their allowed settings and policy constraints should be checked for the relevant observing cycle.[75][76][86]
What Is the Astronomer’s Proposal Tool?
The Astronomer’s Proposal Tool, abbreviated APT, is used to construct, validate, and submit observing proposals and configure their observations. For JWST it organizes targets, instrument templates, exposure parameters, acquisition steps, and special requirements. Its visual planning tools help examine footprints and scheduling implications.
APT does not replace the science argument or automatically establish that a requested measurement is feasible. Observers normally develop exposure estimates separately and transfer the chosen settings into the proposal, then resolve warnings and verify that the resulting program matches the intended scientific design.[86][87]
How Do Researchers Select Instrument Settings?
Researchers start with a plausible source spectrum and spatial model, then test settings that cover the desired features. Filters or dispersers define the wavelengths; apertures define the sampled region; readout patterns, groups, and integrations establish cadence and signal accumulation.
The ETC helps assess signal-to-noise ratio and saturation under an appropriate background model. Dithers and background exposures address sampling and calibration needs. Selecting settings is therefore an iterative problem: a configuration that meets a signal goal may still fail because of saturation, contamination, acquisition difficulty, or excessive overhead.[67][75][76]
How Are Multi-Instrument Observations Planned?
Programs combine instruments when the additional data address a distinct physical question, such as linking stellar structure to dust emission or joining atmospheric bands across wavelengths. Sequential observations can place the same target in different apertures. Supported parallel observations instead collect data in offset fields, since instruments look at different parts of the focal plane.
Some internal combinations, such as MIRI MRS with simultaneous imaging, have their own rules. Timing, footprint, exposure synchronization, and permitted template pairings must therefore be checked rather than assuming any instruments can observe the same object together.[8][88][89]
What Are the Main Limitations of JWST Instruments?
Every mode has boundaries set by wavelength response, field coverage, detector saturation, background, and the available exposure configurations. Slitless spectra can overlap, narrow apertures can lose source light, and long-wavelength observations have broader diffraction patterns.
Observatory constraints also limit when a target and orientation are accessible because the telescope must remain protected by its sunshield. Available observing time and overheads further shape program design. These limits do not negate Webb’s capabilities; they define the conditions under which a particular scientific measurement can be made reliably.[69][90][91]
Scientific Discoveries Enabled by JWST Instruments
Webb’s discoveries emerge from the connection between a scientific question and a measurable signal. Deep images identify distant objects and complex structure, spectra test physical interpretations, and time series reveal changes too small to recognize in a single exposure.
The examples below illustrate these methods rather than offering a changing list of record holders. This approach also keeps instrument descriptions grounded: a published result demonstrates a particular measurement under particular conditions, not a guarantee that every similar target can be observed with equal precision.[21][77][92]
How Does Webb Observe the Earliest Galaxies?
Cosmic expansion stretches radiation from early galaxies into infrared wavelengths. NIRCam images can identify candidates through characteristic colors and the disappearance of flux below a redshifted spectral break. NIRSpec then tests candidate redshifts using spectra, while other instruments can add useful constraints when the sources are detectable.
Brightness alone does not establish distance or age, and photometric estimates can admit alternative interpretations. Secure conclusions combine the spectral evidence with models and uncertainties, distinguishing a confirmed redshift from more model-dependent estimates of stellar mass or formation history.[30][55][80]
How Do JWST Instruments Reveal Star Formation?
Near-infrared imaging exposes stellar populations hidden in many visible-light views, while mid-infrared observations emphasize surrounding dust and molecular environments. Spectroscopy helps distinguish ionized gas, shocked material, and other emission mechanisms.
The Tarantula Nebula provides a practical example: NIRCam shows young stars, MIRI changes the emphasis toward cooler material, and NIRSpec can analyze selected regions. Together these observations connect the stars with the gas and dust from which they formed. Interpreting feedback or evolutionary state still requires physical models and supporting information about the region.[20][21][93]
How Does Webb Investigate Planetary-System Formation?
Planet-forming disks contain gas and solids at many temperatures and distances from their host stars. Near-infrared observations can trace scattered light and selected emission features, while MIRI spectra measure warm molecular gas and dust diagnostics.
In PDS 70, MIRI detected water-vapor emission associated with the inner disk, demonstrating access to chemistry in a region relevant to rocky-planet formation. Such spectra do not directly inventory every future planet. They constrain the disk material and conditions, with longer-wavelength facilities adding information about colder outer regions.[92][94][95]
How Do JWST Instruments Advance Exoplanet Research?
Webb’s instrument suite measures atmospheric absorption, planetary emission, and selected directly imaged companions. WASP-39 b illustrates the value of spectroscopy: NIRSpec observations established a clear carbon-dioxide feature, and broader investigations using several near-infrared modes constrained additional atmospheric species and photochemistry.
MIRI adds access to other molecular bands and thermal measurements. These results depend on target suitability and careful treatment of instrument behavior. Studying a hot giant planet successfully does not imply that the same precision is achievable for every smaller or cooler planet.[77][78][79]
How Do Researchers Combine Webb With Other Telescopes?
Different observatories measure different parts of the same physical system. Hubble adds ultraviolet and visible information, while ALMA traces millimeter and submillimeter emission from colder dust and gas. Combining these with Webb can connect young stars, obscuring clouds, and heated material. Scientific combination requires matching astrometry, accounting for different angular resolutions, and considering observations taken at different times.
It is more demanding than overlaying attractive pictures. Each dataset contributes its own sensitivity limits and calibration uncertainties, which must remain visible in the resulting physical interpretation.[95][96][97]
Frequently Asked Questions About James Webb Space Telescope Instruments
The most common questions about Webb’s instruments concern the number of systems, their different purposes, and what their measurements can reveal. Several short answers require a qualification. For example, the sharpest conventional image is not the same as the best specialized close-companion measurement, and an instrument’s name does not describe every mode it offers.
These answers retain those distinctions while pointing back to the scientific principles and practical limitations that determine which instrument is appropriate for a particular observing task.[1][2][3][4][5]
How Many Instruments Does the James Webb Space Telescope Have?
Webb has four science instruments, plus a separate Fine Guidance Sensor. The science instruments are NIRCam, NIRSpec, MIRI, and NIRISS. Lists that include five named systems are usually counting FGS alongside the science equipment because it belongs to the payload and enables stable observations. The distinction is functional rather than a disagreement about hardware. FGS produces guidance and calibration data, but it is not offered as an additional general-observer science instrument in the way that the four primary instruments are.[1][7]
What Are the Four Main JWST Scientific Instruments?
The four main science instruments are the Near-Infrared Camera, the Near-Infrared Spectrograph, the Mid-Infrared Instrument, and the Near-Infrared Imager and Slitless Spectrograph. Their abbreviations are NIRCam, NIRSpec, MIRI, and NIRISS. Together they provide images, spectra, interferometric measurements, and time-series data across complementary wavelength ranges.
Their names describe their central identities, but the mode descriptions are more informative: NIRCam can obtain spectra, MIRI includes multiple spectroscopic approaches, and NIRISS provides both ordinary imaging and specialized high-angular-resolution measurements for suitable targets.[2][3][4][5]
What Is the Difference Between NIRCam and NIRSpec?
NIRCam is Webb’s main conventional near-infrared imager, while NIRSpec is designed around flexible near-infrared spectroscopy. A typical galaxy program might use NIRCam to locate objects and estimate colors, then NIRSpec to measure their redshifts and spectral features.
NIRCam also offers grism spectroscopy, so the distinction is not simply pictures versus spectra. NIRSpec adds selected-target microshutter observations, fixed slits, and an integral field unit. Those entrance-aperture choices and its dispersers make it better suited to many detailed spectroscopic investigations.[17][22][24][28]
What Is the Difference Between NIRCam and MIRI?
NIRCam mainly covers approximately 0.6–5.0 µm, while MIRI extends into a nominal 4.9–27.9 µm envelope. Their observations consequently emphasize different mixtures of stellar light, gas, dust, and planetary emission. NIRCam generally provides finer conventional angular detail at its shorter wavelengths; MIRI accesses mid-infrared features and thermal signals that NIRCam cannot measure.
MIRI also needs a dedicated cryocooler. Comparing the two is therefore about matching the scientific signal and wavelength, not choosing one universally superior camera for every astronomical target.[11][4][34]
What Does NIRISS Stand For?
NIRISS stands for Near-Infrared Imager and Slitless Spectrograph. It belongs to Canada’s Webb contribution and is packaged with the Fine Guidance Sensor, although their optical systems and responsibilities differ. NIRISS offers four main mode families: imaging, wide-field slitless spectroscopy, single-object slitless spectroscopy, and aperture masking interferometry.
Its full capability envelope extends approximately 0.6–5.0 µm, but each mode uses a narrower or selected portion. The full instrument range should therefore not be substituted for the actual coverage of a SOSS or WFSS observation.[42][43]
Why Does Webb Need the Fine Guidance Sensor?
Webb must hold astronomical targets steady relative to its instrument apertures and detector pixels. FGS tracks a guide star and supplies position information used by the observatory’s pointing-control system. Without sufficiently stable guidance, images could blur and spectral or photometric measurements could change because the target moved rather than because its light changed.
This is especially consequential for narrow apertures and precision time series. FGS supports these measurements continuously during normal guiding, while mirror alignment and calibration address different sources of error.[53][54]
Which JWST Instrument Takes the Sharpest Images?
For conventional direct imaging, short-wavelength NIRCam observations generally provide Webb’s finest angular detail because diffraction patterns shrink with decreasing wavelength and its short-channel pixels sample finely. The answer changes if the task is a specialized measurement of close bright companions: NIRISS aperture masking interferometry can recover structure at very small separations using interference information.
Pixel scale, wavelength, target brightness, and reconstruction method all matter. There is therefore no useful single ranking that treats ordinary images, coronagraphic detections, and interferometric companion measurements as identical tasks.[49][50][62][63]
Which JWST Instruments Study Exoplanet Atmospheres?
All four science instruments can contribute through appropriate configurations. NIRISS SOSS, NIRSpec BOTS, NIRCam grism time series, and MIRI LRS are prominent options for repeated spectra around transits and eclipses. Other suitable modes provide complementary photometry or measurements of directly imaged companions.
The instrument choice depends on the spectral band, host-star brightness, event duration, and required precision. Combining datasets can increase wavelength coverage, but analysts must assess calibration differences, stellar changes, and the fact that separate observations may sample different atmospheric or stellar conditions.[18][31][39][46]
Can Webb Instruments Observe Visible Light?
Webb’s shortest science wavelengths reach approximately 0.6 µm, overlapping the red portion of the visible spectrum. It is therefore inaccurate to say it detects absolutely no visible light. However, its design and principal science coverage are infrared, and it does not provide the broad ultraviolet and visible capability associated with Hubble.
Whether a particular visible-red interval is measurable depends on the selected instrument and mode. The overall short-wavelength boundary should not be interpreted as coverage of all colors that human eyes can see.[1][11][96]
Why Do Webb’s Infrared Detectors Need Cooling?
Detectors can generate electrical signal even without incoming target photons, and warm components radiate infrared light. Cooling reduces important unwanted contributions and helps create stable operating conditions for faint-source measurements. Webb uses a sunshield and passive cooling for its cold telescope environment, while MIRI’s longer-wavelength detectors need additional active refrigeration below about 7 kelvin.
The near-infrared systems operate at different, warmer cryogenic temperatures. Cooling is consequently tailored to the detector technology and wavelength rather than applying one identical temperature requirement to every instrument.[34][70]
What Is the NIRSpec Microshutter Array Used For?
The microshutter array selects sky locations whose light should enter NIRSpec during multi-object spectroscopy. Opening carefully chosen shutters lets many selected objects produce spectra in one exposure while blocking much of the surrounding field.
The hardware contains roughly a quarter-million shutters, but useful multiplexing depends on source positions, working shutters, overlap constraints, and the observing setup. Accurate astrometry and target acquisition are essential because a source near an aperture edge loses light. Astronomers therefore plan shutter configurations rather than simply opening one shutter for every visible object.[23][24][25]
Which Instrument Measures the Chemical Composition of Galaxies?
NIRSpec is a principal tool for near-infrared spectroscopic diagnostics of galaxies, including emission lines used to infer chemical enrichment and physical conditions. MIRI adds mid-infrared molecular, ionic, and dust information, while NIRISS and NIRCam spectroscopy can contribute where their modes cover suitable features.
Composition is inferred from calibrated spectra and physical models rather than read directly from an image color. Several features are usually needed because line strength also depends on temperature, ionization, density, dust attenuation, and the structure of the emitting region.[22][38][48]
What Is the Difference Between Imaging and Spectroscopy?
Imaging measures how brightness is distributed across the sky within a chosen passband. Spectroscopy measures how light changes with wavelength, providing much finer spectral discrimination than a typical imaging filter. Both can describe the same object, but they answer different parts of a scientific question. Images reveal morphology and identify targets; spectra test redshifts and physical diagnostics.
Integral field spectroscopy combines the two kinds of information in a compact region. The distinction concerns the measurement configuration, since all four Webb science instruments include some spectroscopic capability.[13][45][58]
What Is a JWST Spectral Data Cube?
A spectral data cube organizes measurements along two sky coordinates and one wavelength coordinate. Selecting one wavelength plane gives a narrow spectral image, while selecting a spatial element gives a spectrum. Webb produces such cubes from NIRSpec IFU and MIRI MRS observations after reconstructing their sliced detector measurements.
The third axis is normally wavelength, not physical depth through the object. Analysts must also consider sampling, reconstruction correlations, and changing angular resolution across the cube before interpreting small spatial or spectral differences as physical structure.[28][38][58]
How Do Scientists Download JWST Instrument Data?
Scientists search MAST using its web interfaces or programmatic tools, identify suitable observations, and select the required data products. Someone examining a finished image may start with a combined product, while a researcher reprocessing a spectrum may need the uncalibrated exposures and supporting metadata. Public files are broadly accessible, whereas exclusive-access files require the appropriate authorization.
Before analysis, users should inspect instrument mode, quality flags, calibration version, and known issues. A downloaded file is a scientific starting point whose processing history remains relevant to its interpretation.[83][84][85]
Can Astronomers Use Multiple Instruments for the Same Target?
Yes. A program can schedule observations that place the same target into different instrument apertures, producing complementary wavelength and measurement coverage. This commonly involves separate observations and repointing because the instrument footprints occupy different sky positions. Supported parallel observations usually collect data in offset fields rather than giving all instruments an identical view of one object.
When combining the results, researchers must account for different apertures, angular resolutions, calibration, and observing dates. These considerations are especially important for variable sources or spatially complex targets.[8][88][89]
Conclusion: How Webb’s Instruments Work Together to Reveal the Universe
NIRCam maps near-infrared structure, NIRSpec supplies flexible spectral diagnostics, MIRI reveals mid-infrared emission and features, and NIRISS adds specialized spectroscopy and interferometry. FGS provides the guidance those observations need. Their scientific power depends on cold detectors, stable optics, appropriate observing modes, and calibrated data rather than any single instrument specification.
By combining images, spectra, and time series, astronomers can test interpretations that one dataset leaves uncertain. MAST then preserves those observations so new analyses and improved calibration can continue extending their scientific value.[1][60][83]
Sources
The references below prioritize NASA mission explanations, STScI’s current JWST User Documentation, and the official calibration-software documentation. Technical specifications should be checked against the relevant mode page before preparing an observing proposal, because performance depends on wavelength, aperture, detector configuration, and calibration.
Rounded overview values are useful for comparison but do not replace detailed sensitivity calculations. Numbered superscript references throughout the article connect claims with these source pages; operational information was reviewed for this article on 20 October 2026.
[1] NASA: Webb’s Scientific Instruments
[2] STScI: JWST Near Infrared Camera
[3] STScI: JWST Near Infrared Spectrograph
[4] STScI: JWST Mid Infrared Instrument
[5] STScI: JWST Near Infrared Imager and Slitless Spectrograph
[6] NASA: Integrated Science Instrument Module
[7] STScI: JWST Fine Guidance Sensor
[9] STScI: Comparing Multi-Object Spectroscopy With Different JWST Instruments
[10] STScI: Integrated Science Instrument Module
[11] STScI: NIRCam Instrumentation
[12] STScI: JWST Wavefront Sensing and Control
[14] STScI: NIRCam Detector Overview
[15] STScI: NIRCam Coronagraphic Imaging Recommended Strategies
[16] STScI: NIRCam Coronagraphic PSF Subtraction Operations
[17] STScI: NIRCam Grisms
[18] STScI: NIRCam Short Wavelength Grism Time Series
[19] STScI: NIRCam Time-Series Observations
[20] NASA: Two Views of the Tarantula Nebula
[21] NASA: Tarantula Nebula, NIRCam Image
[22] STScI: NIRSpec Dispersers and Filters
[23] STScI: NIRSpec Micro-Shutter Assembly
[24] STScI: NIRSpec Multi-Object Spectroscopy
[25] STScI: NIRSpec MOS Operations, Slit Losses
[26] STScI: NIRSpec Fixed Slits Spectroscopy
[27] STScI: NIRSpec Fixed Slits
[28] STScI: NIRSpec IFU Spectroscopy
[29] STScI: NIRSpec IFU Operations
[30] The NIRSpec Wide GTO Survey, Astronomy & Astrophysics
[31] STScI: NIRSpec Bright Object Time-Series Spectroscopy
[32] STScI: JWST Time-Series Observations Roadmap
[33] STScI: MIRI Wide Field Slitless Spectroscopy
[34] NASA: Webb Telescope’s Coldest Instrument Reaches Operating Temperature
[35] STScI: MIRI Detector Overview
[36] STScI: MIRI Detector Performance
[37] STScI: MIRI Filters and Dispersers
[38] STScI: MIRI Medium Resolution Spectroscopy
[39] STScI: MIRI Low Resolution Spectroscopy
[41] ESA/Webb: The Life and Times of Dust
[42] NASA: Fine Guidance Sensor / Near Infrared Imager and Slitless Spectrograph
[43] STScI: NIRISS Observing Modes
[44] STScI: NIRISS Wide Field Slitless Spectroscopy
[45] STScI: JWST Wide Field Slitless Spectroscopy
[46] STScI: NIRISS Single Object Slitless Spectroscopy
[47] STScI: NIRISS SOSS Recommended Strategies
[48] STScI: NIRISS WFSS Recommended Strategies
[49] STScI: NIRISS Aperture Masking Interferometry
[50] STScI: NIRISS AMI Recommended Strategies
[52] STScI: NIRISS Imaging Recommended Strategies
[53] STScI: JWST Fine Guide Stability
[54] STScI: JWST Time-Series Observations Noise Sources
[55] NASA: What Is Cosmological Redshift?
[56] STScI: JWST Slit Spectroscopy
[57] NASA: Mid-Infrared Instrument
[58] STScI: JWST Integral Field Spectroscopy
[59] NASA: How Are Webb’s Full-Color Images Made?
[60] STScI: JWST Science Calibration Pipeline
[61] STScI: Understanding Exposure Times
[62] STScI: NIRCam Point Spread Functions
[63] STScI: NIRISS Point Spread Functions
[64] STScI: JWST Imaging
[65] NASA: Webb FAQs
[67] STScI: NIRCam Detector Readout Patterns
[68] STScI: JWST Background Model
[69] STScI: JWST ETC Backgrounds
[71] STScI: JWST Science Instruments and Observing Modes
[72] STScI: NIRCam Observing Modes
[73] STScI: MIRI Observing Modes
[74] STScI: Key Differences for JWST Time Series Observations
[75] STScI: Getting Started With Planning JWST Observations
[76] STScI: JWST ETC Time-Series Modes
[77] NASA: Webb Reveals an Exoplanet Atmosphere as Never Seen Before
[78] NASA: Webb Detects Carbon Dioxide in Exoplanet Atmosphere
[79] ESA/Webb: WASP-39 b Atmospheric Composition, NIRSpec, NIRCam and NIRISS
[80] NASA: Early Universe
[81] Official JWST Pipeline: Pipeline Stages
[82] STScI: JWST Operations Pipeline Build Information
[85] STScI: Exclusive Access Period
[86] STScI: JWST Astronomers Proposal Tool Overview
[87] STScI: APT Workflow Articles
[88] STScI: JWST Parallel Observations
[90] STScI: JWST Target Viewing Constraints
[91] STScI: NIRISS Bright Limits
[92] NASA: Webb Detects Water Vapor in Rocky Planet-forming Zone
[93] NASA: Tarantula Nebula, NIRSpec IFU
[94] NASA: Water in Protoplanetary Disk of PDS 70, MIRI Emission Spectrum
[97] NASA: Capturing All That Glitters in Galaxies With Webb